Graphing Seeds & Analyzing the Data
By Kayla • April 3, 2018
A fantastic spring/summer math and science lesson for your preschoolers is to have them sort and graph various garden seeds. Here we featured a seed graphing lesson from Creative Tots and we decided to make some printables to go along with it, just in case you and your preschoolers wanted to try it!

Graphing Seeds. Provide your kiddos with a Ziploc bag containing 10 different types of seeds {in varying amounts!}. Invite them to first sort the seeds by type, then glue them to the graphing worksheet.

Analyzing the Data. Using seed identification cards, like the ones we found at Age of Isabella {pictured above}, have your kiddos analyze their data. Have them identify and count to find out which seed they have the most of, the least of, etc. Invite them to record their answers in their science/math journal or print out our simple sample recording sheet. After students analyze their own data, come together as a class to compile and analyze the results {i.e. how many had more sunflower seeds than any other seed, etc}.
Get The Printable(s) For This Activity
About the Creator

Kayla Johnson
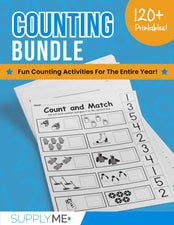
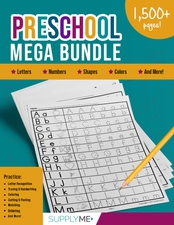
Choose A Bundle That Includes This Printable
Disclaimer: The content on this page is for informational purposes only and reflects the author's personal experiences and/or opinions. The author is not a financial advisor, medical professional, or licensed expert in any regulated field. Nothing on this page should be interpreted as financial, medical, or professional advice. This content is not a substitute for professional advice, diagnosis, or treatment.
Always consult a qualified professional before making decisions related to your finances, health, or other personal matters. The information provided here is shared in good faith, but individual circumstances vary, and what works for some people may not work for you. Results are not typical, implied, or guaranteed. While we strive for accuracy, information may become outdated or change over time. Statements made by guest authors reflect their own opinions and should not be interpreted as endorsements by SupplyMe.
Some of the links on this page may be affiliate or referral links, which means we may earn a commission or bonus if you use them. There’s no extra cost to you — and it’s a great way to support the site if you find the content helpful.